POOL Corp: Q2 ER Update and IRR Calculator
Long-term Steady Winner, Average Returns
Hello subscribers! This post is different than my typical. Wanting to write more in the future, I’m creating anther Section within my Substack called “Watchlist Updates” for updates on companies on my watchlist or companies I have covered before. For now, I have all my subscribers signed up for this new section but if you only want the Long-thesis pitches, email me at fundasyinvestor@gmail.com or leave a comment and I can adjust the settings! With that preface, let’s get into it!
Highlights
Net sales of $1.9 billion; second largest revenue quarter in company history
Operating income of $327.0 million and operating margin of 17.6%
Q2 2023 diluted EPS of $5.91 or $5.89 without tax benefits
Updates annual earnings guidance range to $13.14 – $14.14 per diluted share
Clearly, the second quarter in the middle of the summer will be strong for a pool supplies distribution company! If you’re looking for an in-depth analysis, I covered this company on my “Long-Ideas” last September.
Pool Corp: My Earned Secret
My Earned Secret The term “earned secret” was coined by Mark Leonard, one of the most successful CEO’s in history. It is defined as “knowledge of an opportunity in their industry that isn’t obvious and will allow them to be an early mover, parlaying their secret into a sustainable competitive advantage.” I like to think I have an earned secret and here i…
Since last year, the stock has returned a modest 13.6% compared to the S&P500’s 17.8%.
Operational Updates
New sales centers has picked up slightly YTD, compared to 2021.
End 2021 Sales Center Count: 410 (Domestic: 367, International: 43)
End 2022 Sales Center Count: 420 (Domestic: 376, International: 44)
YTD 2023 Sales Center Count: 432 (Mix undetermined)
Total sales centers since 2014 have a CAGR of 3.3%. Slow and steady, which is great for a business with recurring maintenance, chemical, and renovation such as this.
(Quick Plug: To support this FREE newsletter, utilize my Stratosphere.io Affiliate Link on the homepage to get 10% discount and get awesome KPI tracking like this for over 1000+ securities! I get a portion of the subscription so it goes a long way to support my writing, in return for a premium service.)
From Peter Arvan in the Q2 ER Transcript (this time from Koyfin):
The company also opened 9 new Pinch A Penny locations to the 275 store network (+3%). Even with this growth, the company managed to control costs with OpEx declining 3% year over year.
Financial Updates
Inventory levels down, which is great. Smart that the company is trying to run a bit leaner than it was during the Supply glut of the past few years.
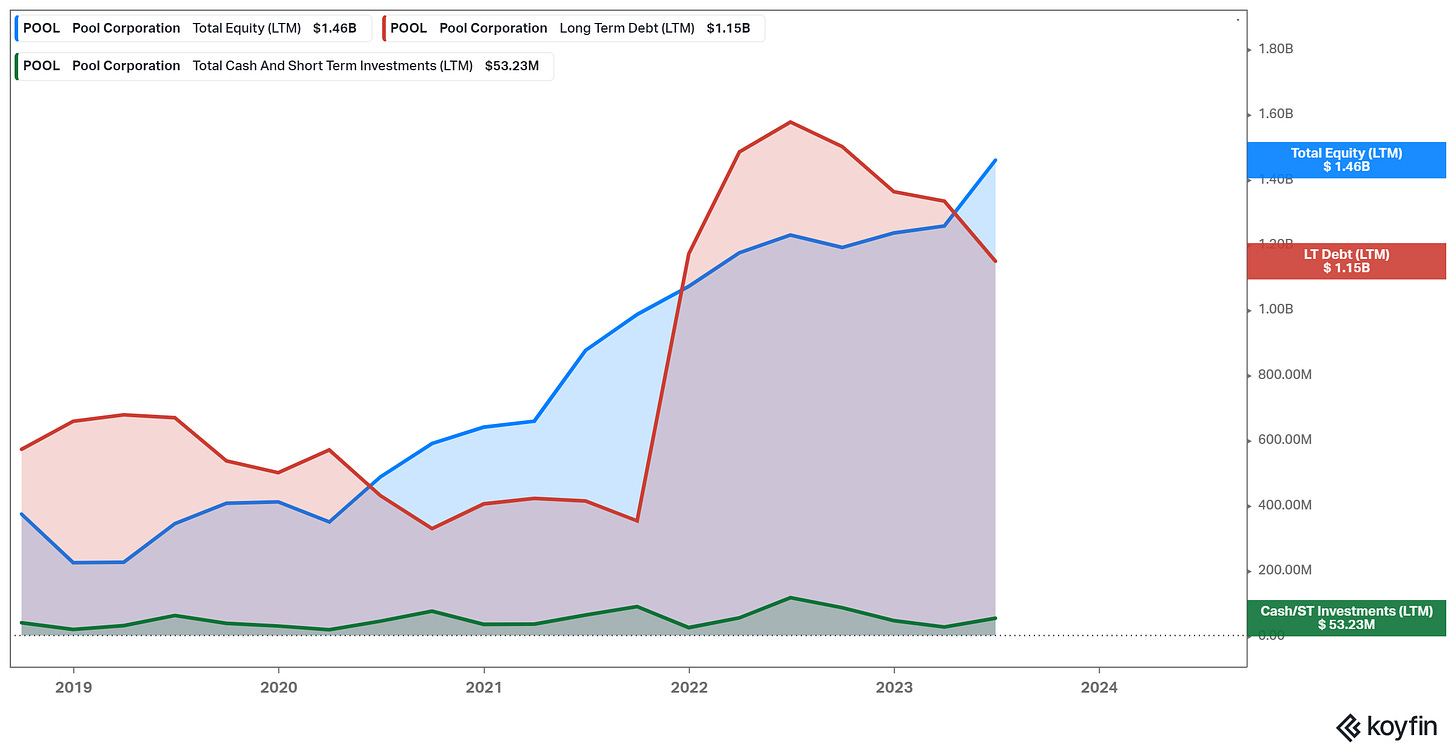
Total debt down to $1.2 billion from $1.6 billion where it was last year.
Commentary
Operational: I think the company is running lean and mean, like it always does. Inventory reduction is good, clearing up some working capital from last year. The company is just growing slowly on its Pinch A Penny store openings (franchise model) and new sales centers, both growing store counts 3%. Definitely steady growth though. It helps that its market has a recurring very consistent nature to it, so growth in revenues can be reasonably retained over time. Inflation pass through on materials and chemicals are consistent growth drivers for the topline too, but require large amounts of capital for procurement, creating EBIT that is greater than Cash from Operations over time.
Financial: Reduced debt is good. EBIT margin of 17.6% is outstanding on gross profit margins of 30.6%. This is the company’s best quarter of the year though so no surprise there, shown by the graph below.
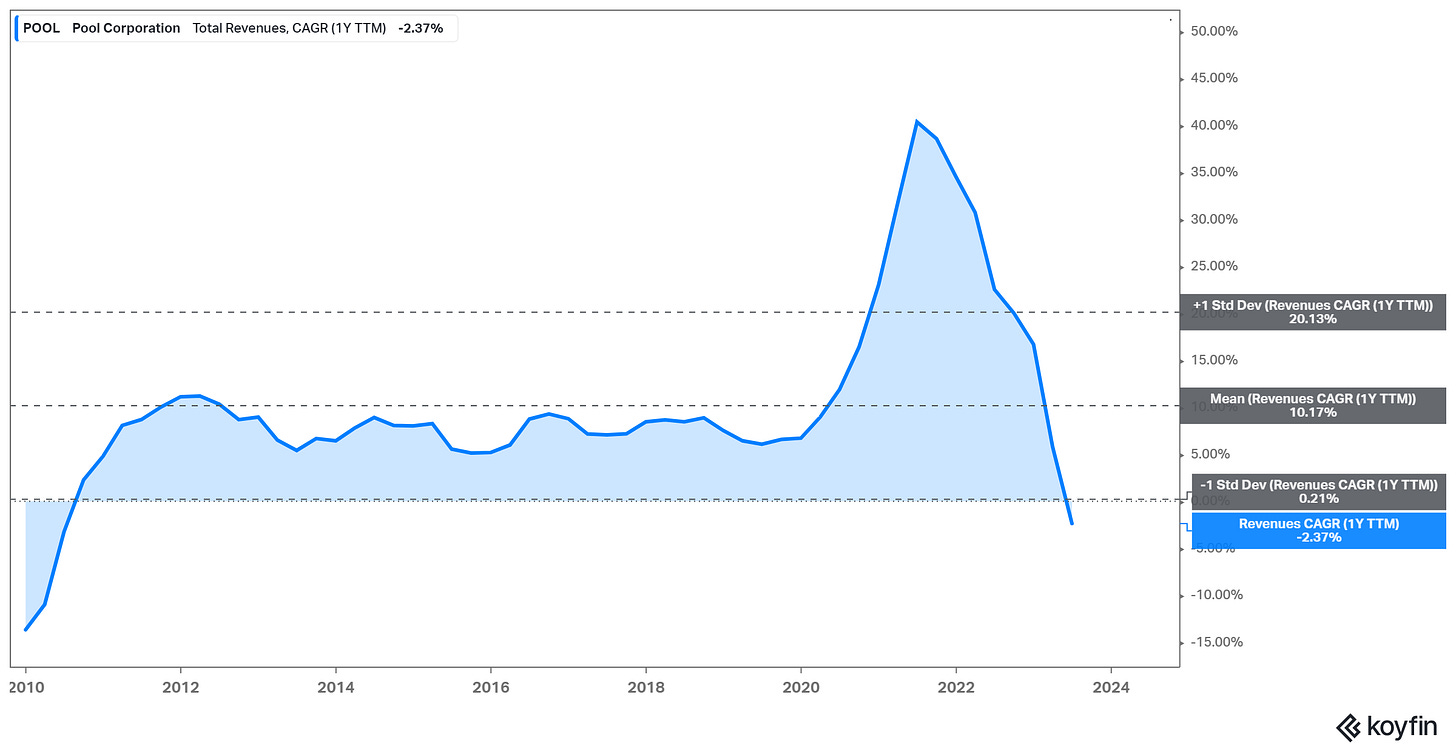
Winter performance has improved over time, due to expanded distribution and growing market share. However, I’d expect a heavy drop off from previous years with winter being stronger than average with supply shortages from 2020-2022. Overall, strong theme of cyclical downturn but steady stellar operational performance.
IRR Calculator
This is the part of this post I’m excited to share periodically. My approach can be summarized by these 5 Pillars:
Forward investment returns can be defined by (1) the overall growth of revenues (2) the margins a company makes on those revenues, trailing and in the future (3) how much cash is generated from those margins (4) how much cash is being returned to shareholders, and (5) how the market will value that capital return.
Conceptually, its an easy to follow framework. Pool Corp will make an excellent example for my readers on how I view future returns.
Topline growth: My assumption for long-term total revenue growth is 7%. With physical distribution of products, a growing and aging pool base, and more technological enhancements for equipment, the company has fantastic built in growth drivers. Add in Pinch A Penny and new sales centers and the company is a steady winner over time. Assumption: 7% growth.
Bottom-line margins: This part is more of an art. The company is currently is translating 1/3rd of its gross profit margins to net income. With the SG&A margin decreasing nearly all it can, I think the company is near “mature margins” unless it can grow its gross profit margin substantially through its retail Pinch A Penny operations. Assumption: 10% increase to bottom line.
Cash Generated: This is a key part of investment returns. If a company can generate amounts of cash on its unit economics, it can reinvest this cash or return to shareholders instead of being of being perpetually tied up in working capital. However, Pool Corp is one such company that has a business model needing constant working capital investments. Hence Free Cash Flow being 70% of net income on average. Assumption: 70% FCF conversion, all CapEx going toward Revenue Growth.
Cash Returned: Based on the below chart, (Repurchase + Dividends) / FCF, Pool Corp has sustainably distributed 85% of FCF to shareholders. Assumption: 85% return.
Multiple: This one is highly subjective. Companies with both high free cash flow conversion and high distribution tend to have higher multiples, due to increasing the yield investors can attain, increasing the value of those earnings. However, investors also care about variance of growth and earnings and Pool Corp is as steady as it comes. For an investment like this, I would put a 15-20x multiple of earnings on fair value, due to its lower FCF conversion and steady yields. Assumption: 15x baseline long-term.
Formula: ( Revenue Growth + Capital Return [ (1/PE) * FCF conv. * Cap Ret] ) * (Multiple Change) * (Multiple Change). Then, annualize this over 10 years for a long-term perspective.
POOL Corp 10-year Return Calculator:
Baseline: ( 7% + 1/PE * 70% * 85% )^10 * (1.10%) * (15 / PE) → 7% IRR
Bullish: ( 7% + 1/PE * 70% * 85% )^10 * (1.10%) * (20 / PE) → 10% IRR
The multiple clearly plays a large part of future returns from here in my opinion. This is why I sold my Pool Corp stock this year in favor of Auto Partner SA (link in Long-Ideas), which has appreciated 51% since February when I initiated my position and still has a 14% forward return on my calculator with a 15x terminal multiple!
I hope this article proved useful for an update on Pool Corp! Thank you for reading. If you enjoyed this article, please subscribe or utilize my referral links and create this process for yourself.
Have a great day guys!


